Bangladesh’s Trusted Learning Platform — Enroll Now & Save Big!
Data Science

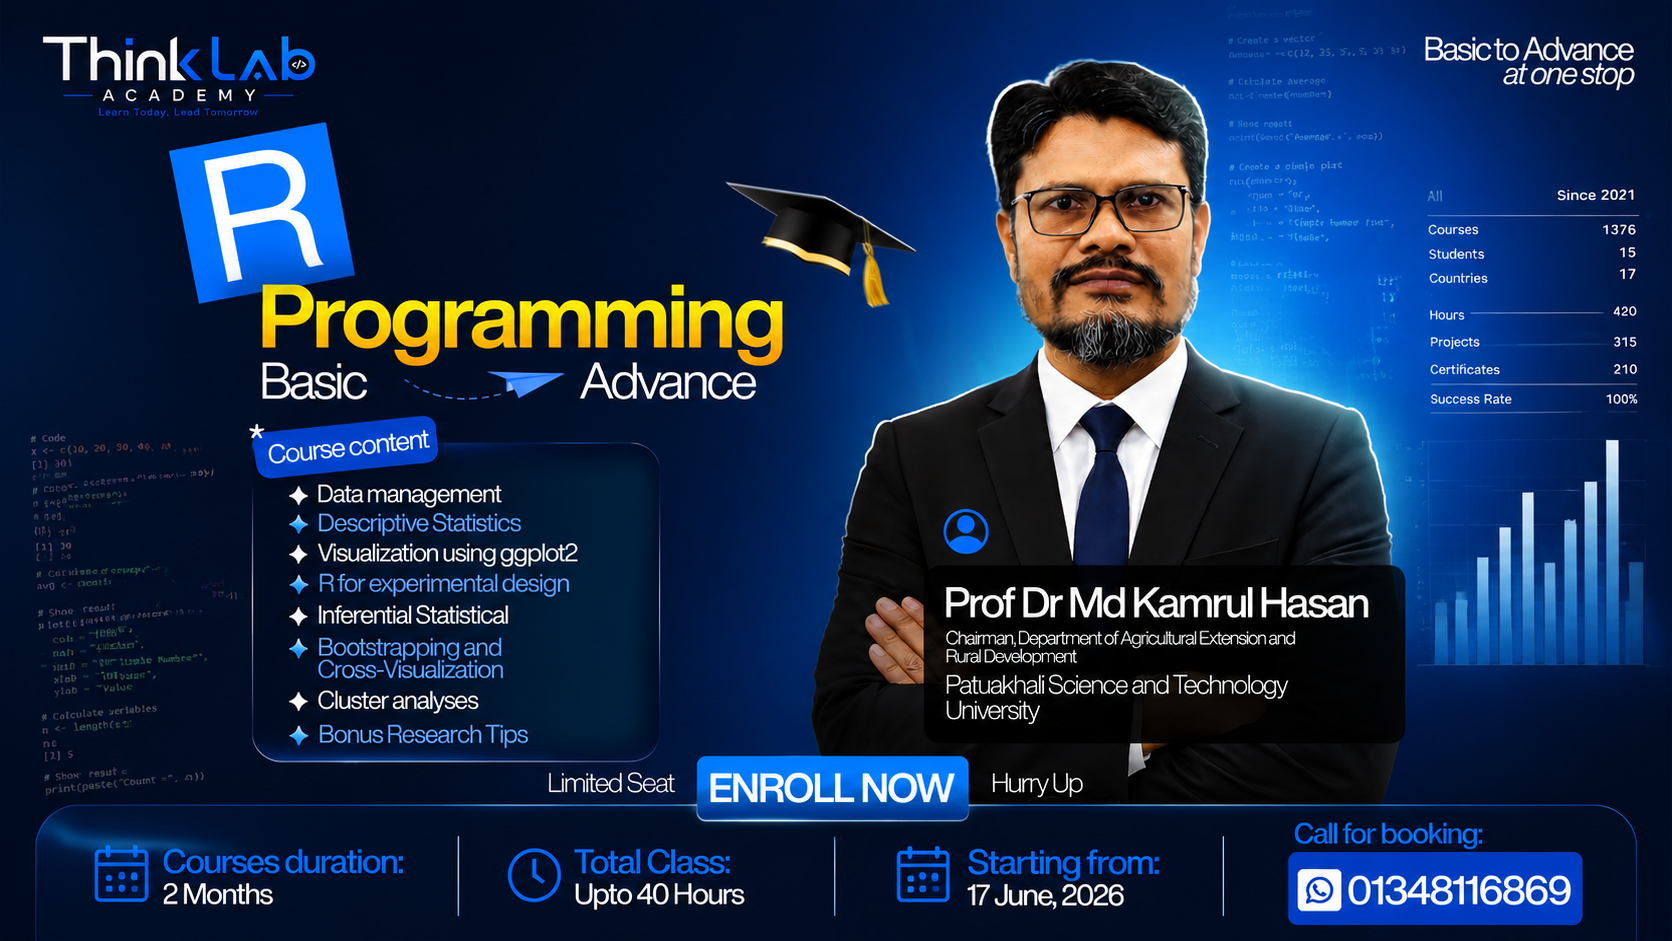
Basic to Advance R Programming

16 live classes with Prof. Dr. Md. Kamrul Hasan — 18 June to 07 August 2026
📂 17 Sections 📚 94 Lessons ⭐ 4.7 (3 reviews) 👥 594 students 📶 all

By Prof. Dr. Md. Kamrul Hasan

What you'll learn

Install and set up R, RStudio and run R inside VS Code
Write clean, reusable code using the DRY principle
Create, save and read data files, and manage large datasets in R
Calculate descriptive statistics: mean, median, mode, SD, SE and CV
Build publication-quality charts with ggplot2 and prepare reports
Handle social survey data: categorization and dataset splitting
Analyse experimental designs — CRD, RCBD, Factorial and Split Plot
Run independent and paired t-tests and the Wilcoxon test
Perform one-way and two-way ANOVA with post hoc analysis
Visualise ANOVA results the way scientific journals expect
Use frequency tables, chi-square tests and correlation analysis
Fit simple and multiple regression models and visualise the results
Apply bootstrapping and cross-visualization techniques
Reduce dimensions with Principal Component Analysis (PCA)
Group observations using cluster analysis

Description

Basic to Advance R Programming is a complete, hands-on journey from installing R to running advanced statistical analysis for research and publication. Across 16 live classes (18 June – 07 August 2026, up to 40 hours) you move from setup and basic coding to descriptive statistics, ggplot2 visualization, experimental design, t-tests, ANOVA with post hoc analysis, chi-square and correlation, simple and multiple regression, bootstrapping, PCA and cluster analysis — finishing with certificate distribution and an open Q/A session. Every class is taught live by Prof. Dr. Md. Kamrul Hasan, and datasets, code files and practice resources are shared for each lecture. Seats are limited so that every student gets personal feedback. Course module & schedule 01 · 18 Jun 2026 — Setup & Installation, DRY coding principle, mathematical operations 02 · 19 Jun 2026 — Data creation & saving, data file reading, descriptive statistics (mean, median, mode, SD, SE, CV) 03 · 25 Jun 2026 — Visualization using ggplot2, preparation of report, R in VS Code 04 · 26 Jun 2026 — R for social survey research, large data management, coding in categorization, splitting dataset 05 · 02 Jul 2026 — R for experimental design: CRD, RCBD, Factorial, Split Plot 06 · 03 Jul 2026 — Independent t-test, paired t-test, Wilcoxon test 07 · 09 Jul 2026 — ANOVA: one-way and two-way 08 · 10 Jul 2026 — Post hoc analysis, visualization of ANOVA for scientific journal articles 09 · 16 Jul 2026 — Frequency table, chi-square test & correlation, visualization of results 10 · 17 Jul 2026 — Simple regression 11 · 23 Jul 2026 — Multiple regression 12 · 24 Jul 2026 — Regression result visualization 13 · 30 Jul 2026 — Bootstrapping & cross-visualization 14 · 31 Jul 2026 — Principal Component Analysis (PCA) 15 · 06 Aug 2026 — Cluster analysis 16 · 07 Aug 2026 — Certificate distribution & Q/A session For admission and details: 01348116869

Course Curriculum

📎 Resourses 🔒
🎬 Introduction || Installation || Interface 🔒
🎬 R Basics: Working Directory Setup, Data Import, and Exploration 🔒
🎬 1. Basic Plot 🔒
🎬 2. Adding a New Variable 🔒
🎬 3. Data Visualization Using the ggplot() Function 🔒
🎬 4. Visual Studio Code (VS Code): Introduction and Setup 🔒
🎬 5. Central Limit Theorem in R || Publishing with RPubs 🔒
🎬 1. Preparing Data for Analysis || How to clean data 🔒
🎬 2. Coding categorization 🔒
🎬 3. Explore height variable 🔒
🎬 4. Using the Pipeing Operator in R 🔒
🎬 5. Using show() || is.na() || mutate() || Formula and Logical Operators 🔒
🎬 6. Select and Filter Function 🔒
🎬 7. Assignment 🔒
🎬 8. Assignment Answers 🔒
🎬 9. Checking Normality of Data 🔒
🎬 10. Visual check of Normality 🔒
🎬 11. Calculating Frequency in R 🔒
🎬 1. Experimental Design 🔒
🎬 2. Introduction to Social Research 🔒
🎬 1. Selecting the Appropriate Statistical Test 🔒
🎬 2. Understanding the t-Test 🔒
🎬 1. One way Anova 🔒
🎬 2. Effect of Treatment Replication and CV 🔒
🎬 3. eta aquare test 🔒
🎬 4. Post-Hoc Analysis 🔒
🎬 5. Homework 🔒
🎬 1. Continuation of Anova 🔒
🎬 2. HSD Test: Additive and Interactive Models 🔒
🎬 3. Visualizing Interaction 🔒
🎬 4. Post Hoc Analysis and Standard Error Calculation 🔒
🎬 5. Using the nlme and lme4 library in R 🔒
🎬 1. Mosaic Plot, chi test, Residual 🔒
🎬 2. Cramer's V 🔒
🎬 3. Conditions of chi sq test || Fisher's Test 🔒
🎬 4. cor.test || Correlation 🔒
🎬 5. Multivariate Correlation Coefffficient 🔒
🎬 6. Mixed Effect Model 🔒
🎬 1. Formula of Regression, Create Data set 🔒
🎬 2. Simple Regression 🔒
🎬 3. See All Residuals 🔒
🎬 4. Simple Correlation 🔒
🎬 5. Visualization 🔒
🎬 6. Model Diagonistic || Linearity of Relationship 🔒
🎬 7. Heteroskedasticity 🔒
🎬 8. Leverage (Cook's Distance) 🔒
🎬 9. Assumption of Linear Regression 🔒
🎬 1. Removing Observations with Missing Values, Loading Data, and Generating a Summary 🔒
🎬 2. Introducing Multicullinearity 🔒
🎬 3. Building a Multiple Regression Model 🔒
🎬 4. Detecting Multicollinearity Using VIF 🔒
🎬 5. Detecting Heteroskedasticity and Its Solutions 🔒
🎬 6. Visualizing Regression Results in R 🔒
🎬 7. Detecting and Solving Endogeneity Problems 🔒
🎬 8. Pairs Plot 🔒
🎬 1. Creating a Dataset for Logistic Regression and Fitting a Logistic Regression Model 🔒
🎬 2. Fitting a Logistic Regression Model and Making Predictions 🔒
🎬 3. Visualization 🔒
🎬 4. Diagonistic Plots 🔒
🎬 5. Resampling Bootstrapping, Cross-validation 🔒
🎬 6. Defining a Bootstrap Function with 100 Bootstrap Iterations 🔒
🎬 7. Bootstrap Results 🔒
🎬 8. Cross Validation || Configure 10 fold CV 🔒
🎬 9. Run Cross Validation 🔒
🎬 10. Visualization 🔒
🎬 11. ROC || AUC 🔒
🎬 1. Why use PCA 🔒
🎬 2. Bartlett's Test and PCA Run 🔒
🎬 3. Visualization 🔒
🎬 4. PCA Rotation Reslut || Screeplot elbow plot 🔒
🎬 5. Bi plot 🔒
🎬 6. What Is Cluster Analysis? 🔒
🎬 7. K-Means Clustering: A Simple Introduction 🔒
🎬 8. Visualization 🔒
🎬 9. Run Cluster Analysis || Visualization 🔒
🎬 10. A. Heirarchial Clustering || Visualization 🔒
🎬 1. What is Factor Analysis 🔒
🎬 2. Sempot for Ploting 🔒
🎬 3. Splitting Data into Two Halves and Cleaning the Split Data 🔒
🎬 4. Determining the Number of Factors: Parallel Analysis, VSS, and Factor Retention Methods 🔒
🎬 5. Correlation among Factors || Visualization 🔒
🎬 6. Define S-factor Structure 🔒
🎬 7. Fit the Confirmatory model, View, Summary, Vizualization, Workflow 🔒
🎬 8. What is Reliability and Validity 🔒
🎬 9. Describe Function|| Alpha Function || Omega Function 🔒
🎬 10. KR 20 🔒
🎬 1. Load Library || Load Data 🔒
🎬 2. Democracy Model || Fit the Path Model || Sum 🔒
🎬 3. Plot the Directional Path Diagram 🔒
🎬 4. Show the Result in Table 🔒
🎬 5. Extract and View Compiled Sum table || see all figures 🔒
🎬 6. Unified model || how to overcome 🔒
🎬 7. SEM 🔒

Instructor

Prof. Dr. Md. Kamrul Hasan
Professor, Department of Agricultural Extension and Rural Development, PSTU

Professor in the Department of Agricultural Extension and Rural Development at Patuakhali Science and Technology University, and Chairman of the department. PhD in Ecosystem Management from the University of New England, Australia, with an Erasmus Mundus joint master's (IMRD) from Ghent, Humboldt and the Slovak University of Agriculture. Researches climate change, food security, farming systems and policy analysis, and works as an applied data analyst in R and Python. Contact: kamrulext@pstu.ac.bd | 01891565856

View full profile →

Student Reviews

4.7
★★★★★
3 reviews
5★
2
4★
1
3★
0
2★
0
1★
0
Mehedi Hasan
★★★★★

Excellent course! The practical examples helped me a lot.

Sumaiya Akter
★★★★★

Very well structured and easy to follow. Highly recommended.

Nusrat Jahan
★★★★☆

Great mentor support and real-world projects.

Course Price
৳ 2,500
৳ 3,500
Enroll Now →

Already have an account? Log in

  • 🎓 Certificate of completion
  • 📱 Access on mobile & desktop
  • 🔓 Lifetime access
  • 🎥 94 lessons